INTERPRETING THE PERITONEAL EQUILIBRATION TEST (PET)
WHAT IS THE PERITONEAL EQUILIBRATION TEST (PET)?
There is considerable inter- and intra-patient variability in solute transport and ultrafiltration capacity in peritoneal dialysis (PD). Peritoneal testing allows for assessment of a patient's membrane characteristics that in turn can be useful for development of patient-optimized PD treatment prescriptions. It can also monitor how peritoneal function varies over time. There are numerous options for peritoneal membrane testing and no one test has been recommended over another. Each test addresses different aspects of peritoneal function. We will focus here on the most commonly performed standard PET, originally described by Dr. Zbylut Twardowski in 1987.
HOW TO PERFORM A PET
The process starts with a long overnight dwell of 8–12 hours. When the patient arrives at the clinic the morning of the PET, the overnight dwell is drained while the patient is sitting up for at least 20 minutes. To ensure as much effluent as possible is drained, the patient can lie down and roll from side to side at the end of the drain.
For the PET, 2L of 2.5% dextrose dialysate is infused over 10 minutes. Every 2 minutes have the patient roll from side to side to mix the dialysate. Once the infusion is complete, immediately drain 200 mL of dialysate. Mix the drained dialysate by inverting the bag several times then obtain a 10-mL sample using aseptic technique.
The remaining dialysate is then reinfused back into the patient. For the remainder of the 4-hour dwell, the patient should be upright and ambulatory. At the 2-hour timepoint, repeat the collection steps (drain 200 mL, mix, aseptically obtain 10-mL sample, then reinfuse) and take a blood sample for serum measurements.
After 4 hours of dwell, completely drain the patient from an upright position for at least 20 minutes. Again, to ensure as much effluent as possible is drained, you can have the patient lie down and roll from side to side at the end of the drain. Accurately measure the drain volume by weighing before collecting a 10-mL sample of dialysate for analysis. All dialysate samples and the serum sample are then analyzed for urea, creatinine and glucose.
UNDERSTANDING PET RESULTS
Once the PET samples are collected, both the serum and dialysate samples are analyzed for urea, creatinine and glucose to calculate equilibration ratios. For urea and creatinine, this is calculated as the dialysate-to-plasma, or D-to-P, ratio. This means that the concentration of urea or creatinine in the dialysate at each time point is divided by the concentration of urea or creatinine in the plasma, or serum, sample. For glucose, dividing the dialysate glucose concentration at each time point by the glucose concentration in the 0-hour dialysate sample results in the equilibration ratios. It is from these equilibration ratios that transport types are determined.
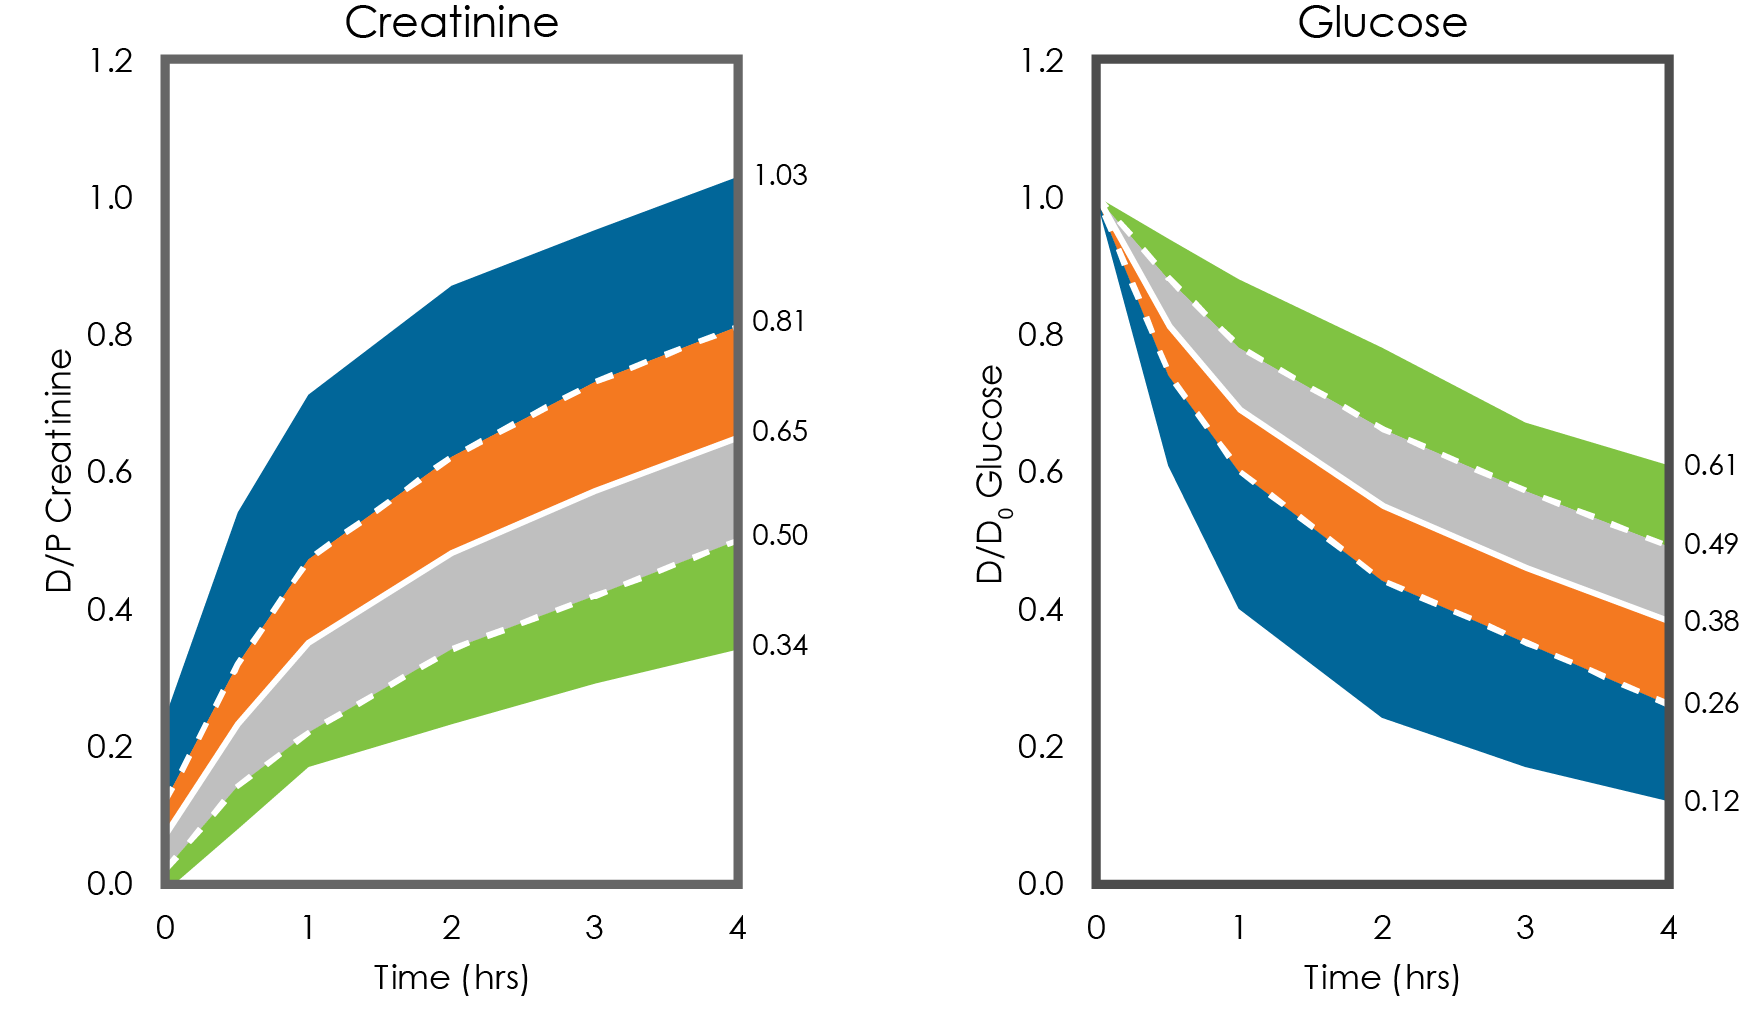
Using data from the original 103 patients, Twardowski created these standardized equilibration curves that are still in use today. The solid white line is the average equilibration ratio for that population. One standard deviation up or down—the dashed white lines—then sets the cutoffs between high and high-average transporters and low and low-average transporters. The outer edges of the blue and green areas represent the maximum and minimums for the group. Generally, patients are categorized based on the 4-hour D/P creatinine and D/D0 glucose ratios. For example, if the 4-hour D/P creatinine is 0.59 and the 4-hour D/D0 glucose is 0.47, the patient would be classified as low average. Some labs may not report the D/P urea ratios or urea transport classification, but the urea data may be required for prescription modeling. Importantly, the transport type classification should be consistent among the three measures.3
USING THE PET TO OPTIMIZE PD PRESCRIPTIONS
There are published recommendations of clinical implications for PD prescriptions based on PET transport type. High and high-average transporters equilibrate rapidly. This means their transports for urea and creatinine are fast, but it also means they lose the glucose gradient rapidly, so ultrafiltration is limited. These patients would do best with more frequent exchanges with shorter dwells in order to avoid reabsorption. PD Plus or Icodextrin should be considered for daytime dwells. It may be possible to have dry periods if the patient has good residual renal function.
On the other hand, low and low-average transporters equilibrate slowly. This means their transports for urea and creatinine are slower, which results in good ultrafiltration with minimal reabsorption, even for a long day dwell. But they may require longer dwells with higher-volume exchanges in order to get adequate clearance.
While the PD prescription has to be individualized for every patient, general recommendations for PD regimens based on PET transport type have been given. For high transporters, short exchanges with a cycler may be well suited and it may be possible to have dry periods if there is good residual renal function. High-average transporters may do cycler or manual exchanges, and dry days may be possible in some cases. For low-average, good residual renal clearance CAPD or CCPD is possible, meaning continuous 24-hour therapy with no dry periods. Without significant residual function, high-dose CAPD, meaning larger-dwell volumes, may be necessary. For low transporters of average body size, high-dose CAPD may work best. For larger low-transport patients, achieving PD adequacy, goals may be more challenging and require some creativity with their individual PD prescription.
POTENTIAL ERRORS OF THE PET AND HOW TO MINIMIZE THEM
Here are some common mistakes than can influence PET results. Prior to the PET, not doing the overnight long dwell or incompletely draining the overnight dwell or, for diabetic patients, not testing blood glucose to ensure levels are less than 235 mg/dL can lead to inaccurate results. During the actual PET, not following the standardized procedure with a 2-L fill, 2.5% glucose, not filling and draining within the specified times, not taking samples at the right times, incomplete mixing of the samples or lack of ambulation for patient during the dwell can all affect the PET results. Lastly, errors in labeling or samples getting switched can happen. As mentioned before, it is also important to check the validity of the PET lab results (i.e., the transport type classification should be consistent among the three measures of glucose, creatinine, and urea).
References
- van Biesen W, Heimburger O, Krediet R, Rippe B, La Milia V, Covic A, Vanholder R, ERBP working group on peritoneal dialysis. Evaluation of peritoneal membrane characteristics: clinical advice for prescription management by the ERBP working group. Nephrol Dial Transplant. 2010;25(7):2052-2062. Available from: http://www.ncbi.nlm.nih.gov/pubmed/20203287
- Misra M, Khanna R. The clinical interpretation of peritoneal equilibration test. Semin Dial. 2014;27(6):598-602. Available from: http://www.ncbi.nlm.nih.gov/pubmed/25139767
- Twardowski ZJ, Nolph KO, Khanna R, Prowant BF, Ryan LP, Moore HL, Nielsen MP. Peritoneal Equilibration Test. Perit Dial Int. 1987;7(3):138-148. Available from: http://www.pdiconnect.com/cgi/content/abstract/7/3/138
- Blake P, Burkart JM, Churchill DN, Daugirdas J, Depner T, Hamburger RJ, Hull AR, Korbet SM, Moran J, Nolph KD. Recommended clinical practices for maximizing peritoneal dialysis clearances. Perit Dial Int. 1996;16(5):448-456. Available from: http://www.ncbi.nlm.nih.gov/pubmed/8914175
- Misra M, Khanna R. Peritoneal Equilibration Test. UpToDate. 2018;Topic 1972 (Version 14.0).
- Misra M, Khanna R. The clinical interpretation of peritoneal equilibration test. Semin Dial. 2014;27(6):598-602. Available from: http://www.ncbi.nlm.nih.gov/pubmed/25139767.
- Prowant BF, Moore HL, Twardowski ZJ, Khanna R. Understanding discrepancies in peritoneal equilibration test results. Perit Dial Int. 2010;30(3):366-370. Available from: http://www.ncbi.nlm.nih.gov/pubmed/20424200.
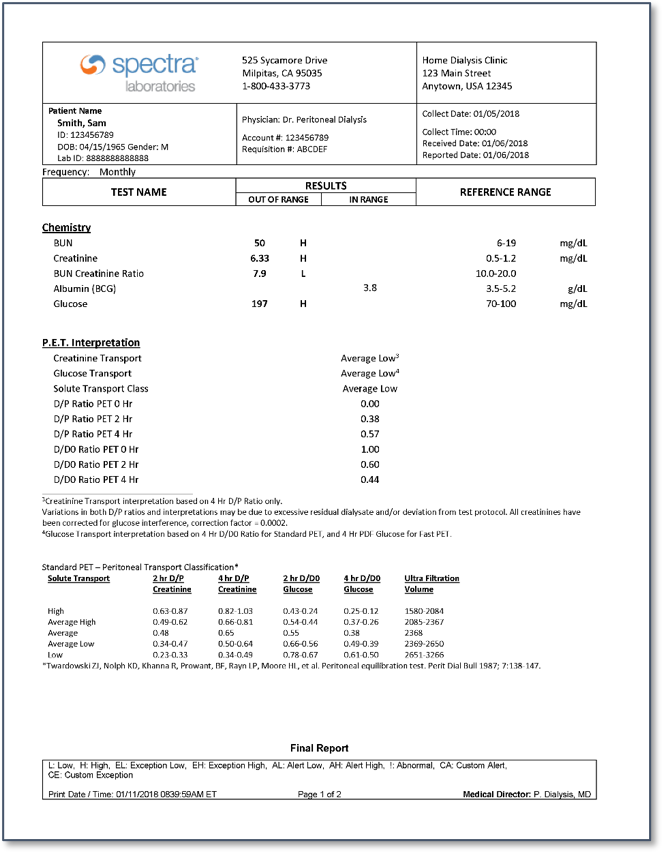
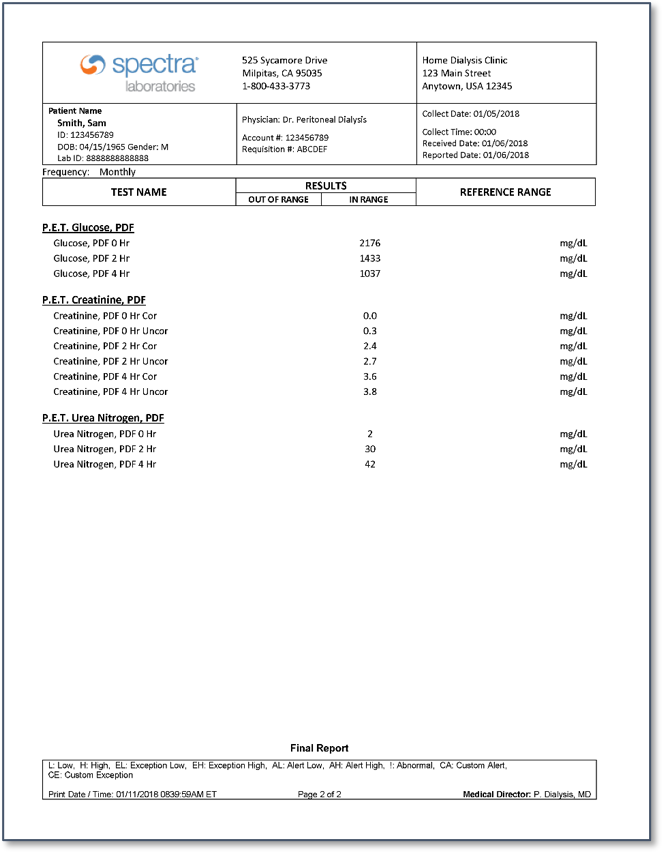
Appendix: Sample PET lab report

© 2006-2024 Fresenius Medical Care. All Rights Reserved.