UNDERSTANDING ICH CAHPS AS A MEASURE OF HEALTH CARE QUALITY
In-Center Hemodialysis Consumer Assessment of Healthcare Providers and Systems (ICH CAHPS) provides insight into the patient experience and is used as a measure of health care quality. To understand it as a measure of quality, it’s important to examine its implementation and use and acknowledge some of the challenges. Overcoming methodological issues may ultimately help improve the measurement and understanding of the patient experience.
ICH CAHPS as a Quality Measure
The use of the ICH CAHPS survey as a measure of health care quality has evolved substantively over the last five years (Figure 1).1,2,3,4 The importance of ICH CAHPS is, in part, reflected by the considerable weight attributed to it in the end-stage renal disease (ESRD) Quality Incentive Program (QIP) and in the ESRD Seamless Care Organizations (ESCOs) established as part of the Comprehensive ESRD Care (CEC) Demonstration Program. In 2018, ICH CAHPS will be the highest weighted measure in the ESRD QIP and in the CEC Model (Figure 2).5,6 ICH CAHPS performance is publicly reported on the Dialysis Facility Compare (DFC) website and will be used for a separate set of Star Ratings in October 2018.7 In 2018, ICH CAHPS will become the only quality measure shared among the ESRD QIP, CEC Model, and DFC Star Ratings.

FIGURE 1 | Implementation of ICH CAHPS in quality measurement and public reporting
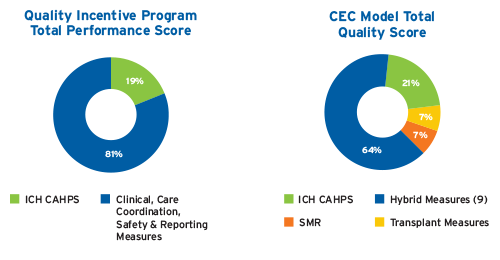
FIGURE 2 | ICH CAHPS in the 2018 ESRD QIP and CEC Model
ICH CAHPS is administered in the spring and fall to adults receiving in-center hemodialysis. Fresenius Kidney Care (FKC) contracts with Press Ganey to use mixed-mode survey administration. The questionnaire is mailed, and if there is no response, then Press Ganey attempts up to 10 follow-up phone calls. The written questionnaire is composed of 62 questions and is approximately eight pages in length.8 ICH CAHPS performance is determined by patient responses to three global rating questions and questions that make up three composite measures; each composite measure reflects performance on multiple questions.9 In the ESRD QIP and CEC Model, only responses in the “top box” are used to assess performance, meaning that only ratings of 9 or 10 or responses of “always” / “yes” contribute to performance on the rating and composite measures, respectively.10 In contrast, the proposed methodology for the ICH CAHPS Star Ratings include the range of potential responses.11
The use of ICH CAHPS in quality measurement differs between the ESRD QIP and the CEC Model in important ways. Two key differences in methodology are: 1) the minimum number of surveys required for facility inclusion, and 2) the determination of performance thresholds. In a performance period, the ESRD QIP requires a minimum of 30 surveys per facility; in the CEC Model, facilities with a minimum of 11 surveys are included in the ESCO-level quality measure.12,13 In the ESRD QIP, the performance standards are generally based on prior national performance, and the achievement, performance standard, and benchmark are set at the 15th, 50th, and 90th percentiles, respectively.14 In the CEC Model, pseudo-ESCO benchmarking is used to create the 30th, 50th, 75th, and 90th percentiles for the three rating questions; whereas performance on the three composite measures is not benchmarked on actual performance and instead uses absolute 30th, 50th, 75th, and 90th percentiles.15Similar to the ESRD QIP, a minimum of 30 surveys over two survey periods is required for public reporting on DFC and for the planned ICH CAHPS Star Ratings.16
Performance on ICH CAHPS in the ESRD QIP, CEC Model, and Proposed Star Ratings
For the CY2016/PY2018 ESRD QIP, only 46 percent of US dialysis facilities could have their performance assessed for ICH CAHPS (i.e., eligible and =30 completed surveys), and 40 percent of facilities were excluded due to having <30 completed surveys.17National performance on ICH CAHPS in the CY2016 ESRD QIP is shown in Figure 3.18Although ICH CAHPS was pay-for-reporting in performance year 1 of the CEC Model, performance on the quality measures—including ICH CAHPS—was publicly reported (Figure 4).19 The proposed ICH CAHPS Star Ratings have been estimated using data from 2016; of note, only approximately 3,200 US dialysis facilities met criteria for ICH CAHPS Star Ratings based on 2016 data.20
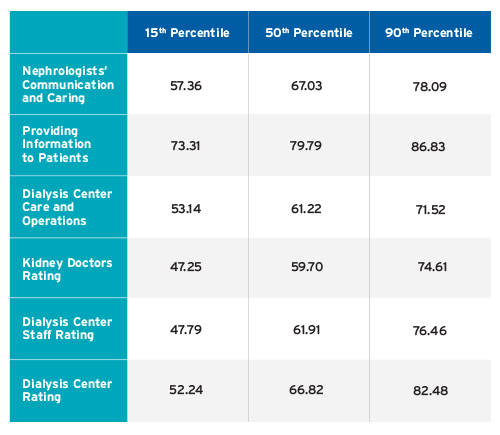
FIGURE 3 | CY2016/PY2018 ESRD QIP National Performance on ICH CAHPS
Performance is based on “top box,” and results are from internal analytics using the ESRD QIP–Complete QIP Data–Payment Year 2018 Dataset
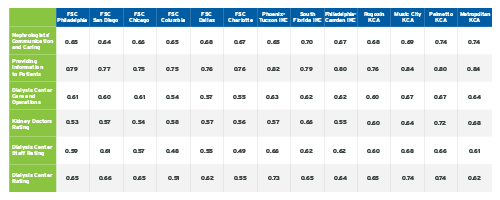
FIGURE 4 | ICH CAHPS Performance by ESCO in Performance Year 1
FSC Fresenius Seamless Care; IKC Integrated Kidney Care; KCA Kidney Care Alliance Table adapted from Medicare Comprehensive End-Stage Renal Disease Care Model Performance Year 1 (Oct 2015–Dec 2016) Results
ICH CAHPS—Opportunities and Challenges
Findings from the ICH CAHPS survey offer the opportunity to understand the experience of care among patients receiving in-center hemodialysis. As a patient-reported measure, ICH CAHPS captures information that is different from other quality measures in use (e.g., measuring processes of care or clinical outcomes). The potential insights are important, and information learned from the survey can reveal opportunities to improve the care experience.
However, a number of challenges exist and should be acknowledged in order to improve the use of ICH CAHPS as a measure of quality. Concerns include: low response rates, representativeness of survey responses, statistical precision, lack of correlation with clinical outcomes, CEC Model methodology, and the exclusive focus on adults receiving in-center hemodialysis. The concerns about whether performance results are truly representative of the care experience within a clinic are based on a number of factors, including the response rates and the potential for and impact of recurrent respondents.
Nationally, CAHPS survey response rates have been declining.21 In 2016, the ICH CAHPS average response rate was only 31 percent.22 It has also been noted that the ICH CAHPS facility-level response rate has a large range, and the minimum of 30 surveys can represent a very different facility-level response rate depending on the number of eligible patients.23 Notably, clinics with =200 eligible patients have all eligible patients surveyed and in these clinics, patients receive the survey during each administration (spring and fall).24 Given the average census of US dialysis facilities, the majority of facilities presumably have patients repeatedly surveyed in a performance period, and one patient could contribute two surveys to the results (performance always reflects surveys from two survey periods).
In terms of statistical precision, the number of surveys returned in a 12-month performance period is on average well below the stated minimum goal of 200.25Among US dialysis facilities with =30 completed surveys in the CY2016/PY2018 ESRD QIP, the median number of completed surveys was 45 (25th percentile 36, 75th percentile 58), and no clinic attained the goal of 200 (the maximum number of completed surveys was 188).26 To our knowledge, the statistical precision of =200 surveys has not been published; this remains an area of uncertainty.
The ICH CAHPS global ratings and composite measures do not correlate with the Star Rating clinical measures (standardized transfusion ratio, standardized hospitalization ratio, standardized mortality ratio, standardized readmission ratio, fistula, catheter, hypercalcemia, and Kt/V).27 Conceptually, this may be important as the quality of patient care Star Ratings based on clinical measures may be discordant with the proposed Star Ratings based on patient-reported experience of care. To what extent the discordance between ratings of clinical measures and of experience of care will cause confusion or require people to prioritize and reconcile discrepancies between the two ratings remains unknown.
The ESCO methodology creates unique challenges. The use of absolute percentiles to determine performance on the three composite measures, instead of benchmarking based on actual performance, is atypical. The standards for quality measures in the QIP are generally informed by actual performance; the use of absolute percentiles creates potentially unrealistic standards at the higher end (e.g., 75th-90th percentiles). The impact of using results from facilities with only 11 surveys is unclear, and it would be helpful to understand how this approach in the CEC Model influences inference. Given the high percentage of US dialysis facilities excluded from the QIP due to <30 completed surveys, the impact of changing the criterion to a minimum of 11 surveys may be substantive. ICH CAHPS results in the CEC Model are not restricted to Medicare beneficiaries, and whether the ESCO-level results are sensitive to changes in care implemented within the ESCOs is unknown.
Concerns have been raised over the lack of a CAHPS instrument for home dialysis and the pediatric population. There is interest in developing CAHPS instruments for patients receiving home dialysis and for pediatric patients receiving dialysis.28Although understanding the experience of care for each of these populations is important, a number of methodologic issues will need to be overcome to account for the relatively small number of eligible respondents per facility. To draw meaningful inference at the facility level will require significant consideration and thoughtful methodology.
Compliance with CMS Rules
Lastly, CMS provides very specific guidance with regards to ICH CAHPS and denotes the importance of not influencing whether patients choose to respond to the survey or how patients answer the questions. The following is verbatim per CMS guidance: “Because of concerns that patients might have about participating in the ICH CAHPS Survey, both ICH facility staff and their ICH CAHPS Survey vendors must avoid influencing patients’ decisions to participate in the survey and their survey responses. Staff at a dialysis facility are not allowed to help patients complete the survey.”29
Meet Our Expert
Lorien S. Dalrymple, MD, MPH
Vice President, Epidemiology and Research, Fresenius Medical Care
Board certified in nephrology, Lorien Dalrymple received her bachelor’s degree from Duke University, her medical degree from the University of Colorado, and her Master of Public Health from the University of Washington. She is co-chair of the National Quality Forum Renal Standing Committee and has served on CMS technical expert panels.
References
Understanding ICH CAHPS as a Measure of Health Care Quality
by Lorien S. Dalrymple, MD, MPH
- Technical notes on the dialysis facility compare star rating methodology for the October 2018 release. October 2017. https://dialysisdata.org/sites/default/files/content/Methodology/Updated_DFC_Star_Rating_Methodology_for_October_2018_Release.pdf
- In-Center Hemodialysis CAHPS Survey. Administration and specifications manual, version 5.0, February 2017. Accessed January 5, 2018. https://ichcahps.org/SurveyandProtocols.aspx.
- Centers for Medicare & Medicaid Services (CMS). Comprehensive end-stage renal disease care model total quality score guide, May 18, 2017.
- CMS. ESRD QIP summary: payment years 2016-2020. https://www.cms.gov/Medicare/Quality-Initiatives-Patient-Assessment-Instruments/ESRDQIP/.
- CEC model quality measure benchmarks performance year 3–2018. December 14, 2017.
- CMS. 42 CFR parts 413 and 414. Medicare program; end-stage renal disease prospective payment system, payment for renal dialysis services furnished to individuals with acute kidney injury, and end-stage renal disease quality incentive program. Federal Register 2017 November 1;82(210). https://www.federalregister.gov/documents/2017/11/01/2017-23671/medicare-program-end-stage-renal-disease-prospective-payment-system-payment-for-renal-dialysis.
- Technical notes on the dialysis facility compare star rating methodology.
- In-Center Hemodialysis CAHPS Survey. Questionnaire: standard version, February 2018. https://ichcahps.org/SurveyandProtocols.aspx.
- In-Center Hemodialysis CAHPS Survey. Administration and specifications manual.
- CMS Center for Clinical Standards and Quality. CMS ESRD measures manual for the 2017 performance period. October 11, 2017. https://www.cms.gov/Medicare/Quality-Initiatives-Patient-Assessment-Instruments/ESRDQIP/Downloads/CMS-ESRD-Measures-Manual-2017.pdf.
- Methodology for producing star ratings for in-center hemodialysis CAHPS survey ratings and composite measures. October 20, 2017. https://ichcahps.org/ICHCAHPS_Star_Rating_Methodology_Report.docx.
- CMS comprehensive end-stage renal disease (ESRD) care model technical specifications for quality measures for calendar year 2018. December 14, 2017.
- CMS ESRD measures manual for the 2017 performance period.
- CMS. 42 CFR parts 413 and 414.
- CEC model quality measure benchmarks performance year 3–2018.
- Methodology for producing star ratings.
- FKC internal analytics using the ESRD QIP-complete QIP data-payment year 2018 datset. https://data.medicare.gov/data/dialysis-facility-compare.
- Ibid.
- Medicare comprehensive end stage renal disease care model performance year 1 (October 2015–December 2016) results. https://innovation.cms.gov/Files/x/cec-fncl-py1.xlsx.
- Methodology for producing star ratings.
- End-stage renal disease dialysis facility compare star ratings technical expert panel: summary report. February 21, 2017. https://www.cms.gov/Medicare/Quality-Initiatives-Patient-Assessment-Instruments/MMS/Downloads/End-Stage-Renal-Disease-ESRD-Dialysis-Facility-Compare-DFC-Star-Ratings.zip.
- Average state and national ICH CAHPS scores based on combined data from the 2016 ICH CAHPS fall and the 2016 spring surveys. https://ichcahps.org/ICHCAHPS_2016_NatlStateAvgs.pdf.
- End-stage renal disease dialysis facility compare star ratings.
- In-Center Hemodialysis CAHPS Survey. Administration and specifications manual.
- Ibid.
- FKC internal analytics using the ESRD QIP-complete QIP data.
- End-stage renal disease dialysis facility compare star ratings.
- Ibid.
- In-Center Hemodialysis CAHPS Survey. Administration and specifications manual.

