LISTENING THROUGH NUMBERS
As technology continues to improve, our ability to aggregate and gain actionable insight from diverse data sources is increasing dramatically. Fresenius Medical Care North America (FMCNA) is on the cutting edge of this transition, moving from descriptive to prescriptive analytics—from hindsight to foresight. By utilizing its large data repositories in combination with external data sources, FMCNA is already creating innovative predictive models to improve patient care
“The musician should find in mathematics a study as useful to him as the learning of another language is to a poet. Mathematics swims seductively just below the surface.”1– Igor Stravinsky
One of the first things children learn after learning to speak is to count. Parents teach children numbers often before they teach them the alphabet. At an early age, children use numbers not only for simple math, but also to express more complex concepts like describing time and age. In life, numbers are intertwined in everything we do. People use numbers to describe the weather, the financial performance of companies, distance and travel, and even well-being.
Numbers are uniquely objective and universally understood. In fact, when traveling internationally and seeing written text, people often focus on the numerals because they can relate to these symbols. Numbers are a universal language. Similarly, patients—even without speaking a common language—can point to an area of bodily discomfort and describe pain on a numeric scale.
The more data available on a patient, the greater the degree to which clinicians can assess the patient’s condition. Kidney disease, and specifically end-stage renal disease (ESRD ), is particularly data rich. In ESRD care, substantial amounts of longitudinal clinical patient data are collected at frequent, predefined intervals due to the frequency of treatment. It’s rare for a segment of health care to have this exceptional data capture opportunity.
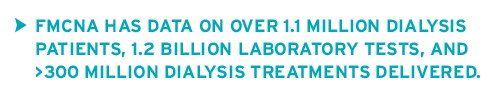
Fresenius Medical Care North America (FMCNA), along with other large dialysis organizations, has collected significant amounts of patient treatment data. FMCNA has data on over 1.1 million dialysis patients, 1.2 billion laboratory tests, and 110 million dialysis treatments delivered. This data is extraordinarily detailed, with hundreds of data elements collected per treatment, many on a per-second interval. Some of these data elements are very structured, such as pure numbers, while others are unstructured. In fact, data comes in a variety of ways beyond numeric, including images, text, paper, and videos. Technology supports converting this data into a language that computers can understand.
Traditional clinical data, typically collected through electronic health records or claims, contains demographic information, clinical parameters, medical history, procedures, and medications, but this may be insufficient to deliver a complete numeric fingerprint of the patient. Just as it is impossible to accurately understand the geography of a region without looking at various layers of information about it, it is impossible to discern the complete story about a patient without seeing clinical data supplemented with data from other sources.2 Aggregating clinical data with additional data sources makes it possible to create an actionable and insightful plan.3,4
What are some of these data sources? Some have existed for many years, while others are becoming available through innovative technology and shared public information (Figure 1). Weather data published by the National Oceanic and Atmospheric Administration can help analytics professionals understand the climate and environment where patients live and can be used in predicting when patients are more likely to miss dialysis treatments.5 Census data, which has been electronically available since the 1990s, assists in identifying which patients live in areas with low household incomes or large household sizes.
Novel , nonclinical data sources are actively being created. For example, to understand a patient’s kinetic activity, walkability scores may help.6 Data on proximity to grocery stores, hospitals, urgent care facilities, and civic center institutions, available through Google, assist in understanding a patient’s home environment.
In addition to utilizing geography-level data sources, real-time data is essential. Patient movement and sleep patterns can be captured by using real-time data from fitness trackers and sensors with patient consent, and this has already proven useful in predicting patient outcomes.7,8 Personal and wearable devices contribute to real-time patient monitoring and automating data collection.
Data from multiple sources provides a truly well-rounded view of the patient. Yet data by itself is not sufficient to create a coherent, actionable patient story. Analytics professionals need ways of putting the story together through data analytics to deliver actionable insights.
A simple visual plot of a patient’s estimated glomerular filtration rate (eGFR) over time can tell a story of how a patient’s disease has progressed; however, eGFR is only one variable. With vast amounts of traditional and nontraditional data, advanced techniques are needed to extract insight from this cacophony of numbers.
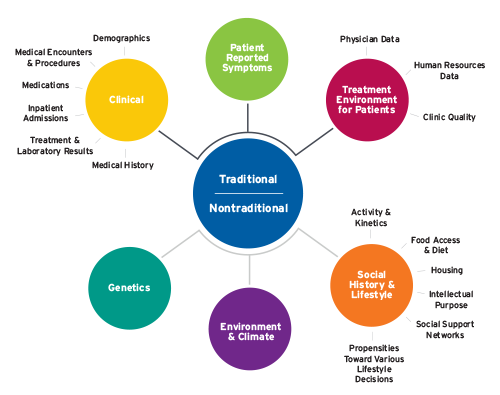
FIGURE 1 | Sources of data
Luckily, methods of extracting meaningful insights have also expanded as the amount of data has increased. Not only has technology advanced, allowing better processing of substantial amounts and types of data, but techniques to extract insight from data are continually expanding. This knowledge can be extracted in a variety of analytical ways (Figure 2):9
- Descriptive analytics describe what happened historically.
- Diagnostic analytics describe why it happened.
- Predictive analytics describe what will happen.
- Prescriptive analytics describe what actions need to be taken to change the prediction.
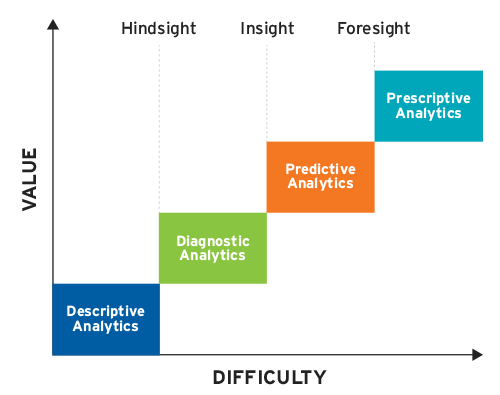
FIGURE 2 | Gartner analytic ascendancy model
When looking at one or two variables over time, visually portraying data can provide great insight. The example of graphing an eGFR over time can help clinicians and patients understand the historic trajectory of kidney function. To understand trends in how an individual patient is doing overall, there are reams of other relevant data points. Descriptive analytics can help reduce these numbers and provide an intuitive way to visualize data.10
Often, descriptive analytics fall short by not providing insight into why particular events happened or what may happen in the future. Descriptive analytics simply provide a historic snapshot or hindsight of what happened. It is also impossible to visualize data when more variables are involved and the interactions between them become complex.11 The field of statistics makes it possible to perform diagnostic analytics. Most scientific studies use diagnostic analytics to explore relationships between variables. These methods can lead to greater insight into the reasons for certain outcomes, like why certain clinics have lower catheter rates than others.
While descriptive analytics and statistics existed for many years, recent attention has switched to more predictive and prescriptive analytics to help clinicians understand what is likely to happen in the future and what actions to take. In health care, predictive analytics (often referred to as “cognitive insight” or “analytics on steroids”) helps clinicians prepare for the future by identifying patterns in thousands of variables in a way that is impossible to see with the naked eye.12 This can be accomplished through artificial intelligence methods such as machine learning. This move from insight to foresight helps clinicians understand where to focus attention. For instance, a warning about which patient is likely to experience intradialytic hypotension in the next few minutes can help clinicians proactively adjust a patient’s ultrafiltration rate, circumventing a dialysis treatment complication.
Foresight is only a component of a truly integrated clinical decision support model. By analyzing factors leading to a prediction and looking at which of these factors can be changed, analytics professionals can begin to shed light on how clinicians and decision makers can influence processes to lead to positive outcomes. Prescriptive analytics allows one to know not only what will happen in the future, but also what actions can alter that outcome.
Discussions of prescriptive analytics often lead to worries about computer algorithms making medical decisions. In truth, these algorithms are tools for clinicians and provide them with an additional all-encompassing data point. Even in scenarios where algorithms have shown great predictive accuracy, studies have repeatedly shown that a combination of human and machine judgment is superior to either used independently.13
As technology continues to improve, the capacity to both acquire and process data will increase. The health care field will move from descriptive to prescriptive analytics, from hindsight to foresight, allowing truly personalized patient care. FMCNA is, and will continue to be, on the cutting edge of this transition.
FMCNA is already utilizing its large data repositories combined with external data sources for a number of predictive models. For example, the Integrated Care Analytics team has created models to predict which patients are at high risk for not showing up for treatment, which patients are likely to be hospitalized before the next treatment, and which patients may require palliative care discussions. The No-Show Predictive Model uses outside data sources, such as data on whether there is a major sporting event or severe weather conditions would occur. The Imminent Hospitalization Predictive Model uses natural language processing and pulls real-time nursing assessment to suggest to the Care Navigation team which patients may need additional support. The latter model processes more than 1,000 variables to come up with its insight, something that would unrealistic without the confluence of data and technology. At FMCNA, these efforts have clearly moved beyond being descriptive and diagnostic into the predictive and now even prescriptive analytics arena, by suggesting what areas will require interventions.
The full analytical spectrum delivered from large data arrays produces unparalleled opportunity for clinicians and patients to have health insight and action. Health care analytics will have depth and complexity like an orchestra delivering a symphony with many instruments, nuances, and cadences intertwined. Clinicians and others will be able to listen to and examine patient stories through a digital fingerprint.
Meet Our Experts
Len Usvyat, PhD
Vice President, Integrated Care Analytics, Fresenius Medical Care
Len Usvyat chairs FMCNA’s Advanced Analytics Steering Committee and works closely with the MONitoring Dialysis Outcomes (MONDO) initiative, an international consortium of dialysis providers. His team provides support and functions in a liaison capacity with traditional and advanced analytical efforts with the company’s pharmacy, vascular care centers, urgent care facilities, health plan, and Medical Office research. He received his doctorate from the University of Maastricht in the Netherlands.
Tommy Blanchard, PhD
Data Science Lead, Integrated Care Analytics, Fresenius Medical Care
Tommy Blanchard works broadly across the organization to create predictive models and advanced analytics support. He uses machine learning to detect patients who are at risk of poor health outcomes to help direct interventions and improve patient care. He earned his bachelor’s degree in computer science and master’s in philosophy at the University of Waterloo, and his doctorate in brain and cognitive sciences from the University of Rochester.
References
Listening Through Numbers
by Len Usvyat, PhD & Tommy Blanchard, PhD
- Du Sautoy, Marcus. Listen by numbers: music and maths. The Guardian, June 27, 2011. https://www.theguardian.com/music/2011/jun/27/music-mathematics-fibonacci.
- Hawgood S, Hook-Barnard IG, O’Brien TC, Yamamoto KR. Precision medicine: beyond the inflection point. Science Translational Medicine 2015;7(300):300ps17.
- IBM Software. Data-driven healthcare organizations use big data analytics for big gains. White paper, IBM Corporation, Somers, New York, February 2013. https://www-03.ibm.com/industries/ca/en/healthcare/documents/Data_driven_healthcare_organizations_use_big_data_analytics_for_big_gains.pdf.
- LeSueur, Dan. 5 reasons healthcare data is unique and difficult to measure. HealthCatalyst, n.d. Accessed January 30, 2018. https://www.healthcatalyst.com/5-reasons-healthcare-data-is-difficult-to-measure.
- Jiao Y, Brzozowski J, Zhang H, Kuang Z, Conti J, Chaudhuri S. Testing of prediction models for end stage kidney disease patient nonadherence to renal replacement treatment regimens. Paper presented at the Women in Statistics and Data Science Conference, Charlotte, NC, 2016.
- Larkin JW, Han M, Williams S, et al. Relationship of neighborhood walkability and dialysis patient characteristics and outcomes. Paper presented at the American Society of Nephrology Kidney Week, New Orleans, LA, 2017.
- Ibid.
- Antman EM, Benjamin EJ, Harrington RA, et al. Acquisition, analysis, and sharing of data in 2015 and beyond: a survey of the landscape: a conference report from the American Heart Association Data Summit 2015. J Am Heart Assoc 2015;4(11).
- Kaduk, Taras. 4 stages of data analytics maturity: challenging Gartner’s model. LinkedIn, December 14, 2016. https://www.linkedin.com/pulse/4-stages-data-analytics-maturity-challenging-gartners-taras-kaduk/.
- Hagerty, John, analyst. 2017 planning guide for data and analytics. Gartner, October 13, 2016. https://www.gartner.com/binaries/content/assets/events/keywords/catalyst/catus8/2017_planning_guide_for_data_analytics.pdf.
- Ibid.
- Davenport, Thomas and Ronanki, Rajeev. Artificial intelligence for the real world. Harvard Business Review January-February 2018:108-116. https://hbr.org/2018/01/artificial-intelligence-for-the-real-world.
- Nagar, Yiftach, and Malone, Thomas. Combining human and machine intelligence for making predictions. MIT Center for Collective Intelligence working paper no. 2011-02, March 2011. http://cci.mit.edu/publications/CCIwp2011-02.pdf.

© 2006-2024 Fresenius Medical Care. All Rights Reserved.